
Contents
In the first months after launch, track a few of the right metrics: how many users reach the key action (activation), how many return after a week and a month (retention), and where they drop off (funnel). Sign-ups and page views say little about whether the product is needed, so plan your events early and collect them from day one.
Here are the metrics that matter for a young product, how to calculate them and how not to drown in dashboards.
Why not track everything?
Do not track everything, because dozens of charts create a feeling of control without helping you decide anything. A young product needs answers to three questions: do people understand the value, do they come back, and what gets in their way?
Vanity metrics that feel good but say little:
- total sign-ups — without activation this is just curiosity;
- page views and time on site — they cannot tell interest from confusion;
- app downloads — without retention, this is ad spend down the drain;
- cumulative charts that always go up, even when the product is standing still.
A good metric changes a decision: if it drops, you know what to do next.
Which metrics matter in the first months?
In the first months, activation, retention, the funnel of the key flow and — for paid products — conversion to payment matter most. Together they show whether users reached value, came back for more and where the product loses them.
| Metric | What it shows | How to calculate |
|---|---|---|
| Activation | Share of new users reaching the key action | Did the key action within N days / signed up |
| Retention | Whether users come back | Share of a cohort active on day 7, day 30 |
| Funnel | Where users drop off in the key flow | Conversion between the flow's steps |
| Paid conversion | Whether people will pay | Paid / activated |
| Churn | How many paying users leave | Cancelled in the month / paying at month start |
What counts as the key action
The key action is the moment a user first gets value from the product. For a food ordering service it is the first order placed; for a CRM, the first deal added; for an online school, the first lesson completed. If you cannot name this action, define it first — everything else depends on it.
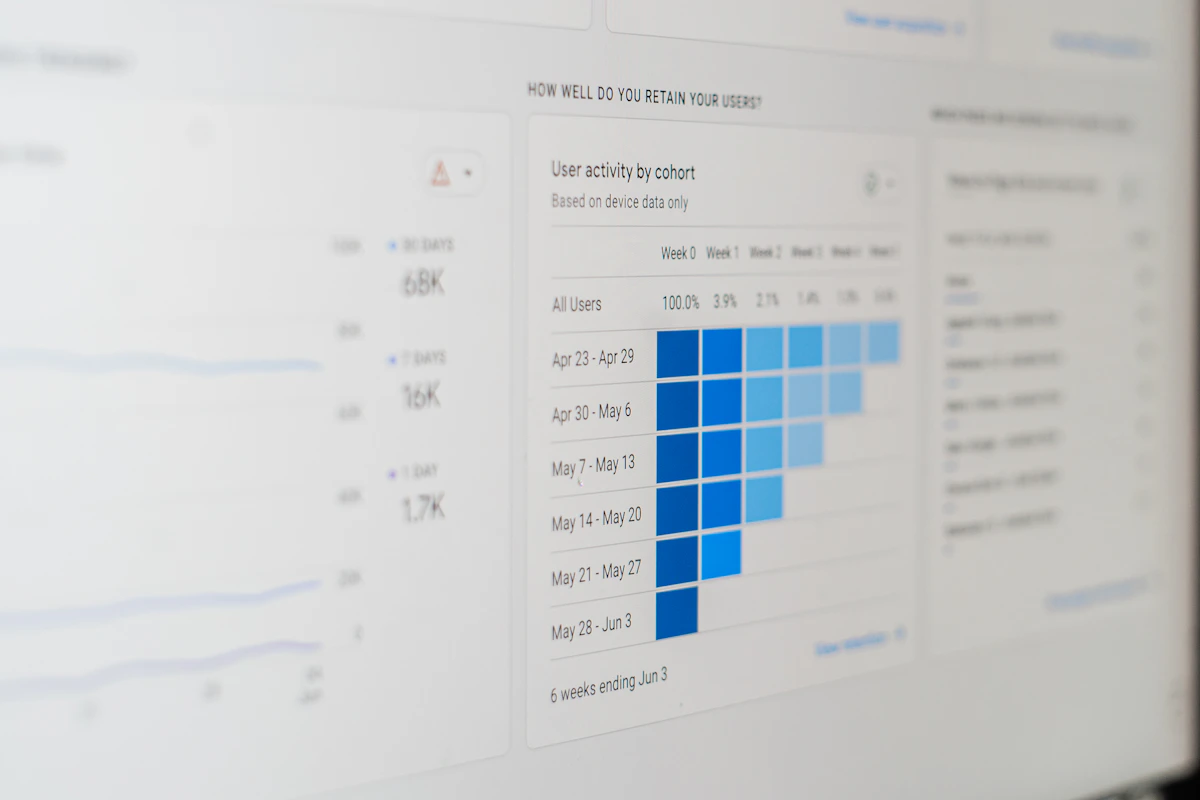 Photo: Unsplash
How do you calculate cohort retention?
Cohort retention works like this: group users by sign-up week and, for each group, see what share was active one, two and four weeks later. Cohorts show whether the product is improving: if newer cohorts retain better than older ones, your changes are working.
An example query over an events table in PostgreSQL:
WITH cohorts AS (
    SELECT user_id, date_trunc('week', min(created_at)) AS cohort_week
    FROM events
    WHERE name = 'signed_up'
    GROUP BY user_id
),
activity AS (
    SELECT DISTINCT e.user_id, c.cohort_week,
           (date_trunc('week', e.created_at) - c.cohort_week) / interval '1 week' AS week_n
    FROM events e
    JOIN cohorts c USING (user_id)
    WHERE e.name = 'order_created'
)
SELECT cohort_week, week_n, count(*) AS active_users
FROM activity
GROUP BY cohort_week, week_n
ORDER BY cohort_week, week_n;
Divide the active count for each week by the cohort size to get a retention table. If the retention curve flattens over time, the product has an audience that needs it. If it drops to zero, the value has not been found yet.
How do you set up event tracking?
Set up event tracking from a tracking plan: describe in advance which user actions to record, with which properties and names. Without a plan, events are added haphazardly, named inconsistently, and after three months nobody trusts them.
Rules we follow:
- Write the tracking plan before development: event, when it fires, which properties.
- Name events consistently: object plus past-tense action —
order_created,lesson_completed. - Send important events from the server, not only the browser: ad blockers and closed tabs must not lose payment data.
- Keep raw events in your own database or warehouse, even if you use a third-party analytics tool.
- Check events on every release — broken tracking is usually discovered too late.
How do you turn metrics into decisions?
Metrics turn into decisions when each has an owner, a target and a regular review. Once a week the team looks at a few key numbers, looks for the causes of changes and chooses what to test next.
What helps:
- one primary metric per quarter that the backlog is built around;
- a hypothesis for every major task: which metric it should move, and by how much;
- comparing expected and actual impact after release;
- talking to users — numbers show "what", interviews explain "why".
Prioritisation methods help decide which hypothesis to test next — see backlog prioritisation.
In short
- In the first months, track activation, retention, the key flow funnel and paid conversion.
- Define the key action — the moment a user gets value.
- Cohort retention shows whether the product is getting better over time.
- Write a tracking plan before development, name events consistently and send important ones from the server.
- Review metrics weekly and tie every major task to an expected impact.
FAQ
Which analytics tool should we choose?
Google Analytics or a similar tool covers web analytics; product analytics calls for dedicated event services or your own warehouse. The tracking plan and keeping raw events yourself matter more than the tool.
What counts as good retention?
There is no universal benchmark: it depends on how often people need the product at all. The shape of the curve — flattening out — and newer cohorts retaining better than older ones matter more.
How many users do we need before metrics can be trusted?
Hundreds of users are enough for rough funnel conclusions; comparing cohorts and running experiments needs more. With low traffic, complement numbers with user interviews — they give answers faster.