Contents
Monitoring and logging exist so you learn about outages before your users and find the cause quickly. The minimum for a web project is an external uptime check, application error tracking, server and database metrics, structured logs and a handful of alerts on events that really matter.
Here is what observability is made of, which signals to collect, how to set up alerts without noise and where a small team should start.
What is observability?
Observability is the ability to understand what is happening inside a system from the data it exposes. It rests on three kinds of signals: metrics, logs and traces. Together they answer "what broke", "where" and "why".
| Signal | What it shows | Example |
|---|---|---|
| Metrics | Numbers over time: load, errors, latency | 2% of responses returned 500 in the last 5 minutes |
| Logs | Individual events with details | Payment for order 1842 failed: bank timeout |
| Traces | The path of one request through every service | An API request waited 3 seconds for the database |
Which metrics should you collect first?
Start with metrics that directly reflect the user experience: error rate, response time and request volume. The "four golden signals" rule covers this.
- latency — how long a response takes, ideally as p95 and p99 percentiles rather than an average;
- traffic — how many requests arrive per second;
- errors — the share of failed responses;
- saturation — how loaded the CPU, memory, disk and database connections are.
Watch business metrics separately: orders, sign-ups and successful payments. If they drop sharply while the technical charts are green, there is still a problem.
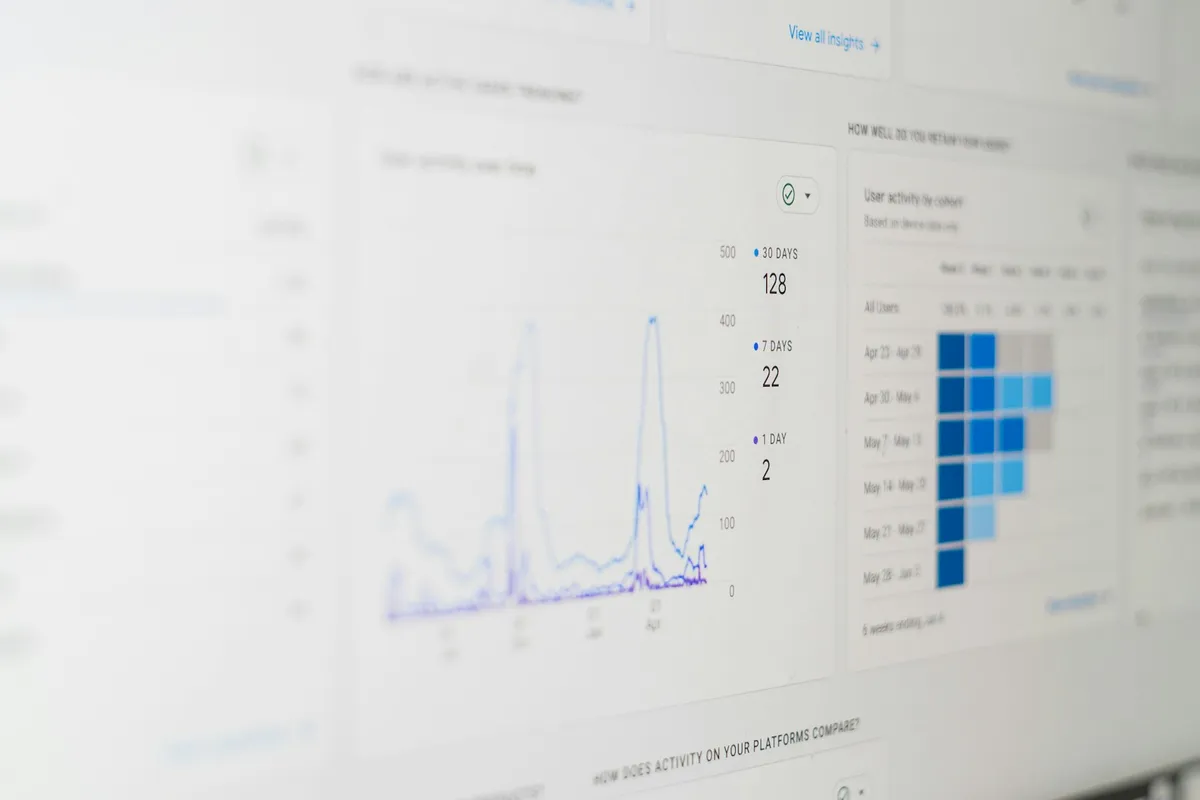 Photo: Unsplash
How should you write logs?
Write logs in a structured form — JSON with consistent fields — so they can be searched and filtered rather than read by eye. Every entry needs a request ID: it ties together all events from a single user request.
{
  "level": "error",
  "message": "Payment failed",
  "request_id": "9f2c1a",
  "order_id": 1842,
  "provider": "bank",
  "duration_ms": 30012
}
Logging rules
- Use levels:
debugfor development,infofor important events,errorfor things that need attention. - Never log passwords, tokens or full card data; mask personal data.
- Collect logs from every server in one place instead of keeping them on each machine.
- Limit retention, or logs will become the most expensive part of your infrastructure.
We covered protecting personal data in personal data on a website.
How do you set up alerts without drowning in notifications?
Alert on symptoms users notice, not on every technical cause. If an alert fires and nobody needs to act, remove it or turn it into a report — otherwise the team learns to ignore every notification.
Good alerts:
- fire on errors or latency rising for more than a few minutes, not on a single spike;
- include a link to the chart and a short note on what to check;
- are split by urgency: critical ones go to the on-call person, the rest to a shared channel;
- are reviewed regularly: noisy ones are deleted, missed incidents become new rules.
Where should a small team start?
A small team can start with managed services and cover four things: an external uptime check, application error tracking, server metrics and centralised logs. This takes a day or two and needs no dedicated specialist.
Steps:
- Add an external check of the home page and API every minute.
- Connect an error tracking service — it shows exceptions with context and the number of affected users.
- Put server, database and queue metrics on one dashboard.
- Ship logs to a single searchable store.
- Set up three to five alerts on key flows: payment, sign-in, checkout.
As the project grows, add tracing and the OpenTelemetry standard. For shipping changes safely, see zero-downtime deployments, and for the cost of ongoing care, website and app support cost.
In short
- Observability rests on metrics, logs and traces.
- The key metrics are latency, traffic, errors and saturation, plus business numbers.
- Write logs as JSON with a request ID and no secrets.
- Alert only on what needs action, or alerts stop being read.
- Start with uptime checks, error tracking, a dashboard and centralised logs.
FAQ
How is monitoring different from observability?
Monitoring answers questions you know in advance: is the service up, have errors increased. Observability lets you investigate new, unexpected problems too, thanks to connected metrics, logs and traces.
How long should logs be kept?
Detailed logs are typically kept for 7–30 days and aggregated metrics for months. Audit events required by law are kept longer, but personal data in logs is best masked.
Does a small project need monitoring?
Yes, but a minimal version: uptime checks, error tracking and basic server metrics. It takes a day to set up and pays off at the first outage.